
on shelterclassroom.com
Graphical Analysis Steps
Basic Steps
Sample hypothesis leading to data collection and analysis: "For a sample of monatomic gas in a closed container, pressure of the gas has an inverse relationship with volume of the gas."
1. Choose the law or equation that relates to the hypothesis.


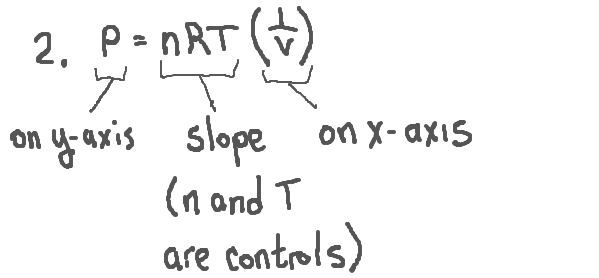
2. Identify the independent and dependent variables based on the procedure summary. Rearrange the equation to get just the dependent variable on one side. Separate the independent variable from the other constants and variables by which it is multiplied.
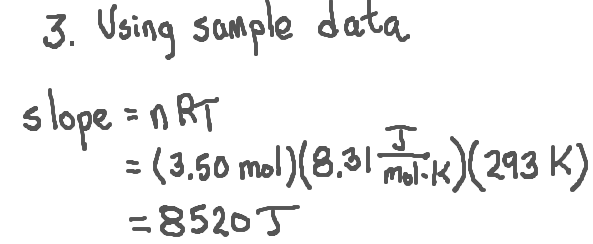
3. Substitute values for constants and controls to find an accepted value for the slope.
4. Make a graph with the dependent variable on the y-axis and the expression containing the independent variable on the x-axis. The graph should be linear. Create a best-fit line and find its slope.
In this case, the graph would be of pressure vs. (volume)-1. Imagine that the slope of the graph is 8340 N/m2.
5. Find the percent error between the accepted and experimental values of the slope.

Variations
In FRQs and possibly in labs, you may be asked to find the value of a variable from the slope of the line. In the example above, the slope can be used to solve for the number of moles: n = slope/RT. This value may then the compared to an accepted value.